Aevum
Precision-health clinic template built around self-drawing biomarker rings and D3 health charts
About This Template
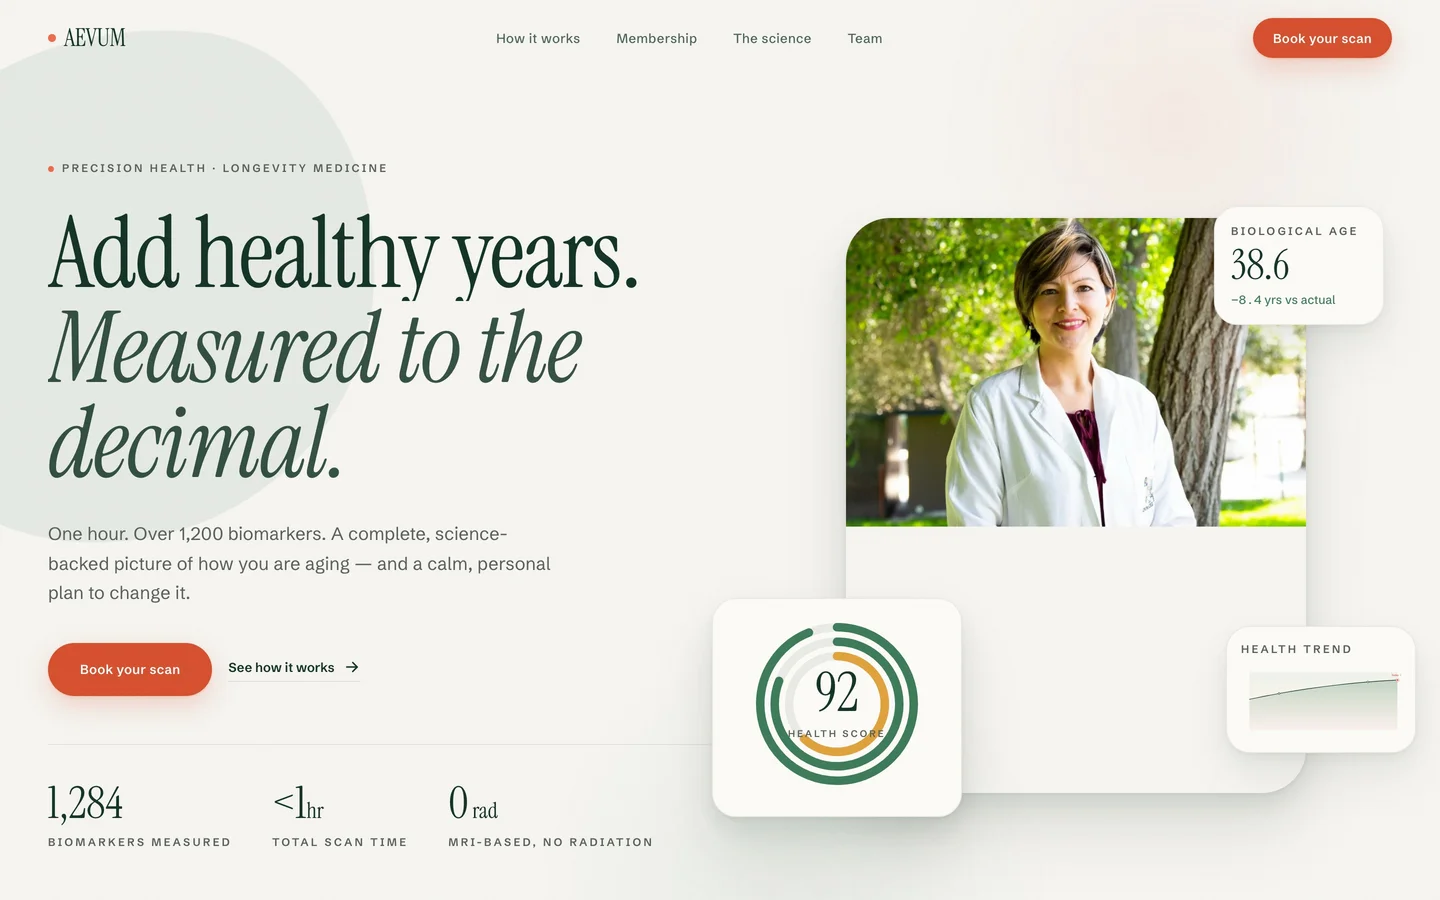
Aevum is a precision-health and longevity clinic template built around live data visualisation. Seven pages cover the clinic story, a four-step assessment journey, the science behind six biomarker systems, three membership tiers with a monthly/annual toggle, the clinical team, and a complete booking flow. The hero pairs an Instrument Serif headline revealed word by word with SplitText and The Vitals: three concentric biomarker rings that draw themselves via stroke-dashoffset, a composite health score, and a biological-age count-up over a parallaxed portrait. The science page renders a longitudinal health chart built with d3-scale and d3-shape — the stroke draws across on scroll over green, amber and coral zone bands with a coral marker pinning today's point — and an interactive SVG body map exposes six measurement sites on hover, tap or keyboard focus. Bone white, forest ink, coral accent, no grid anywhere.
Signature
The Vitals is the whole thesis in one widget: three concentric biomarker rings draw themselves from zero with stroke-dashoffset the moment they scroll into view, each coloured by its own health zone, while a composite score counts up in the centre and a biological age settles at 38.6 against a chronological 47. On the science page the same idea scales to a full longitudinal chart — d3-scale and d3-shape do the maths, GSAP draws the stroke across the zone bands, and a coral marker pins today's point. Reduced motion shows every visualisation in its final drawn state.
Features
- 7 pages — Home, How It Works, Science, Membership, Team, Book, 404
- The Vitals hero widget — three concentric biomarker rings draw via stroke-dashoffset with a composite health score counting up in the centre
- Biological-age readout — chronological 47 against a biological 38.6, animated with a decimal count-up
- SplitText word-by-word headline reveal that waits for document.fonts.ready before splitting
- Longitudinal health chart built with d3-scale + d3-shape (line, area, curveMonotoneX) whose stroke draws on scroll into view
- Meaningful zone spectrum behind the chart — optimal / watch / act bands, never decorative colour
- Interactive SVG body map — six biomarker hotspots that pulse and expand on hover, tap or keyboard focus
- Full booking flow — location, scan type, calendar date and time slot → live summary → validated intake form → confirmation (UI state only, no backend)
- Membership pricing — 3 tiers with a monthly/annual toggle applying a 15% annual discount
- Science page detailing 6 biomarker systems and 34 named markers, from ApoB to epigenetic age
- Four-step assessment journey page with protocol panels and outcome stats
- Team page — clinician portraits with small-caps credentials, specialties and advisory board
- Custom cursor — GSAP quickTo dot with a lagging ring that expands into contextual tags (Book / View)
- Every hydrated island wrapped in an ErrorBoundary so one failure never blanks a section
- Lenis smooth scroll + Astro View Transitions; SEO with MedicalClinic JSON-LD, Open Graph, canonical URLs and sitemap
- TypeScript strict with noUncheckedIndexedAccess, noImplicitReturns and noFallthroughCasesInSwitch — fully typed component props, reduced-motion safe throughout
Need a CMS?
Every template can be delivered as a WordPress, Sanity, or Emdash build — your content team edits copy and images without touching code. Tell us which one you need and we will quote the conversion.
Deployment
Tech Stack
Typography
Instrument Serif (headings, with true italics) + Schibsted Grotesk Variable (body and UI, tabular numerals for every figure) — self-hosted via the Astro Fonts API, so no third-party request and no layout shift
Color Palette
Warm clinical light — #F6F5F1 bone base, #FCFBF8 paper panels, #143527 deep forest ink, #6E7A70 sage secondary text, #E4E2DA hairline rules and a #EE6C4D coral accent; data carries its own meaningful spectrum — #3E7C5A optimal, #E0A33C watch, #E25C4A act